Exploratory Data Analysis
Bitcoin, Ethereum, and Ripple have been selected as representatives in our EDA. Bitcoin and Ethereum well represent mainstream cryptocurrencies that most people are trading with, while Ripple represents new emerging cryptocurrencies with high potentials.
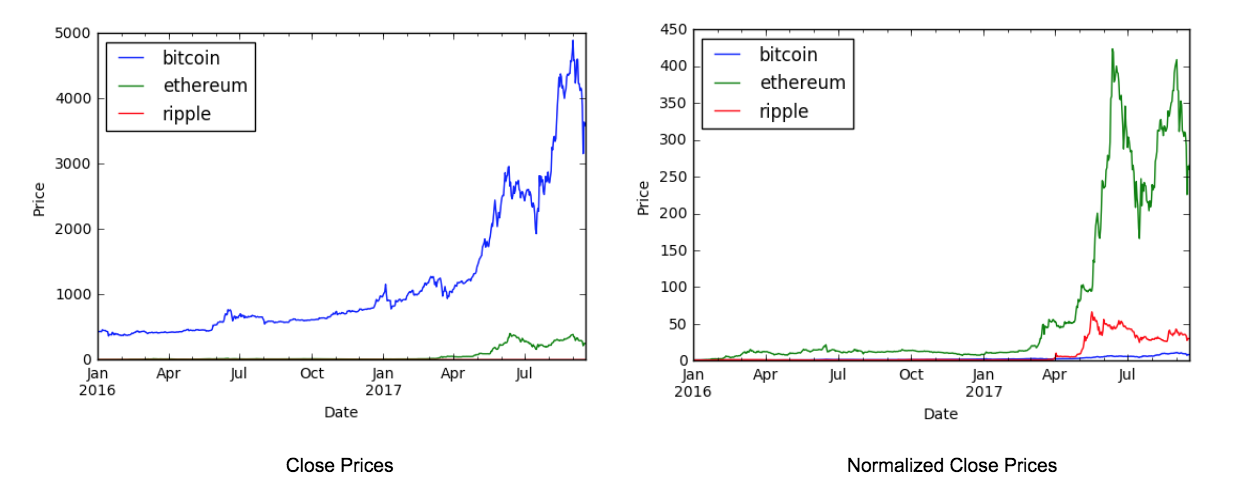
The first dimension we analyze is the price itself. As shown in the graph below, Bitcoin obviously has the highest price amongst all cryptocurrencies, followed by Ethereum, and the price of Ripple is extremely low comparing with others. However, if we look at the normalized prices, Bitcoin becomes the least attractive one amongst all, while Ethereum’s price increases tremendously during the past year. In general, all the prices are increasing throughout the year, which brings potential challenges to our reinforcement model, as the simple buy-and-hold strategy could be good enough.
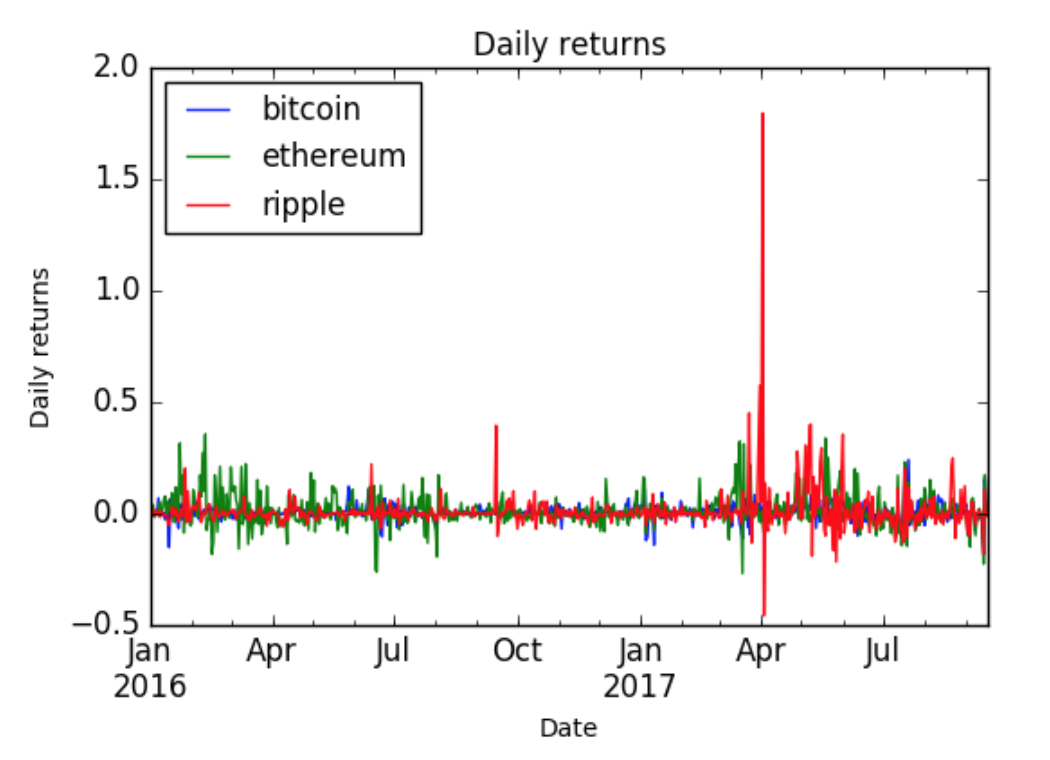
Daily return is another key factor to look at in trading. The graph below plots high frequency oscillations on daily returns for all cryptocurrencies, which indicates the high volatility in the cryptocurrency market, especially for the emerging cryptocurrencies like Ripple.
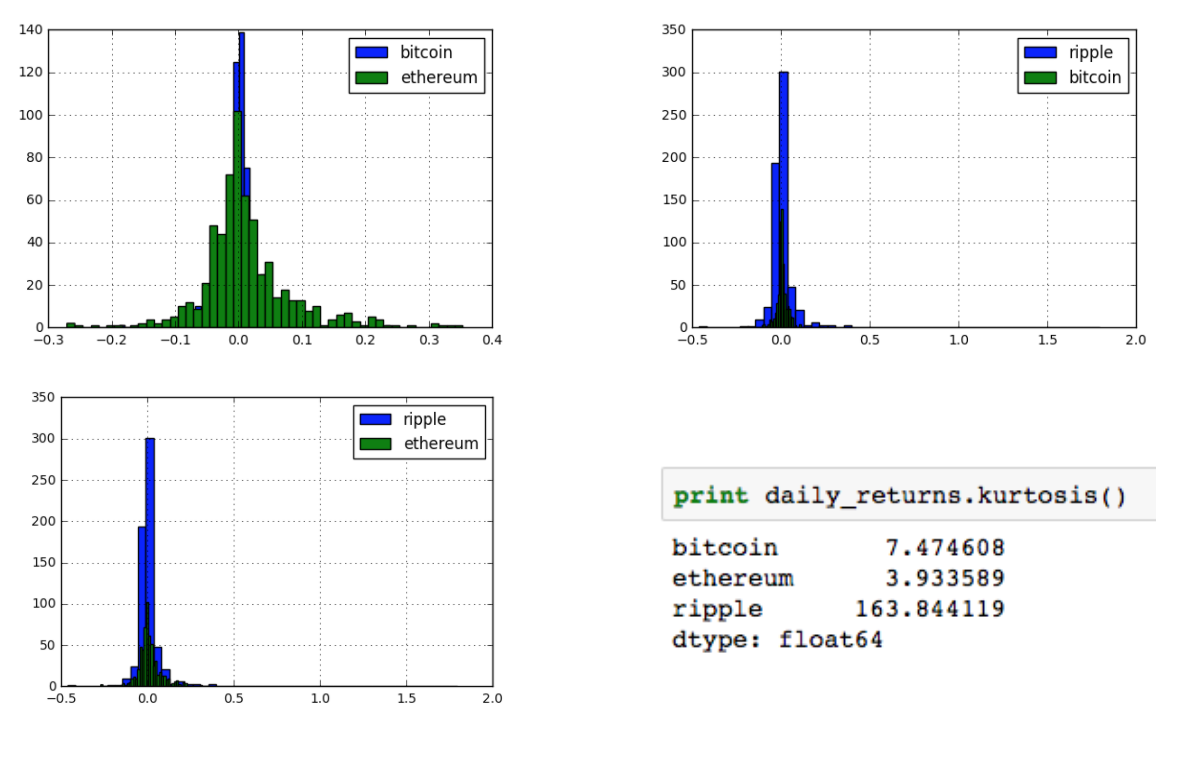
The histograms for daily returns also shows fat tails and large kurtosis for all cryptocurrencies, which suggests that their prices can easily go to extremes, either positive or negative end. This confirms the high volatility feature of the cryptocurrency market.
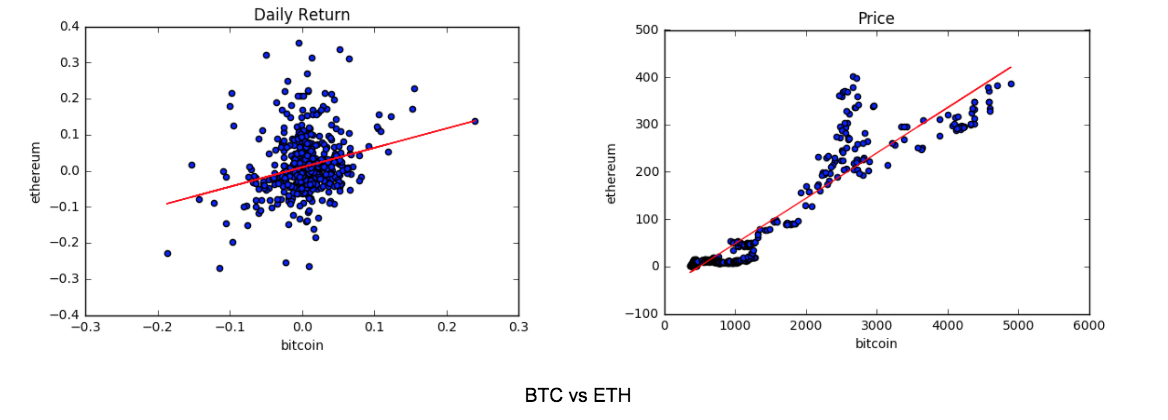
In order to explore opportunities on pair trading, the correlations between each currency pair has been analyzed. From the plots shown below, we identified that the prices of Bitcoin and Ethereum are highly correlated most of the time, and in some cases the price of Ethereum moves much further than that of Bitcoin, which gives us the opportunity for profits in pair trading. It also inspires us to use other cryptocurrencies or market index as one of the states to the reinforcement learning model.
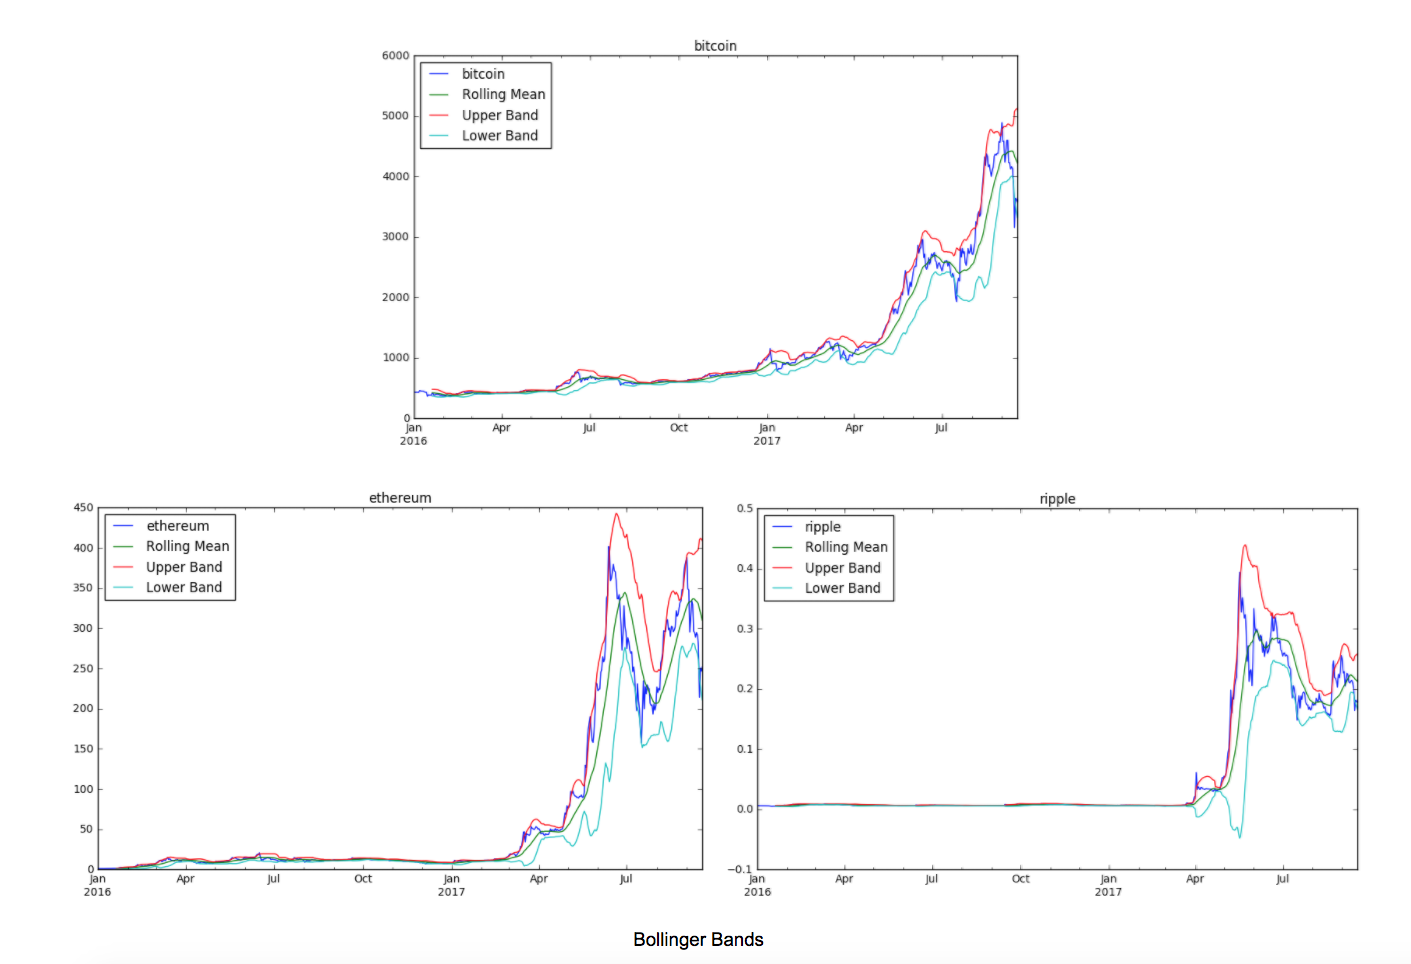
Bollinger Bands is a popular indicator for selling and buying points. It is given by the following formula:
$ Upper Band = MA + 2 \theta $
$ Lower Band = MA - 2 \theta $
$ where MA is the moving average, and \theta is the rolling standard deviation $
The Bollinger Bands can serve as our baseline model, where we can sell when the price crosses the upper band, and buy when the price crosses the lower band. The Bollinger Bands for the 3 cryptocurrencies are plotted below using 20-day rolling window. From the plots we can roughly tell that trading these cryptocurrencies by simply following the Bollinger Bands will give us some profits, which makes it a good candidate of the baseline model.
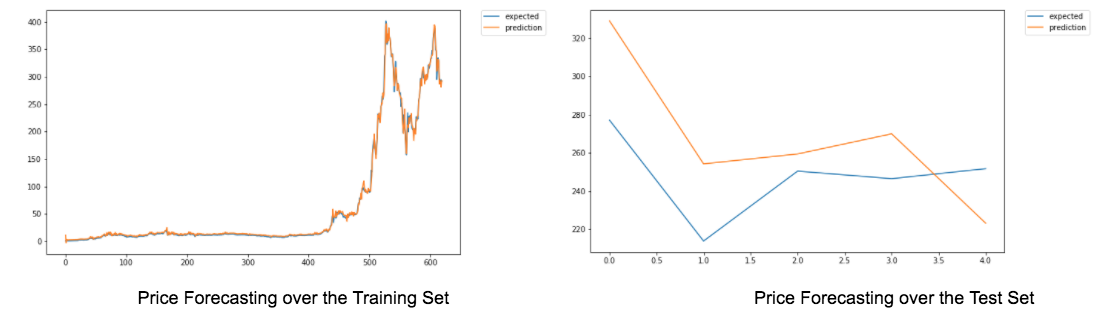
One of the most important techniques in trading is price forecasting. We applied what we learned from W266 and explored the price forecasting using a single layer Long Short Term Memory (LSTM) model over Ethereum, as LSTM is good at processing sequential data. With window size of 7, it gives us reasonable price predictions, as shown below. The price forecasting could serve as a strong state input to our reinforcement model.
Please refer to https://github.com/guangzhixie/cryptocurrency-time-series/blob/master/Cryptocurrencies_EDA.ipynb for a complete jupyter notebook.