Test and Evaluation
And finally, how are we evaluating our results?
We have run the model against 4 different cryptocurrencies, namely Bitcoin, Ethereum, Ripple, and Numeraire. Then we evaluate the total percentage of returns on investment, and comparing with the baseline model that is a simple agent trades based on Bollinger Bands.
The data used in the evaluation is shown below.
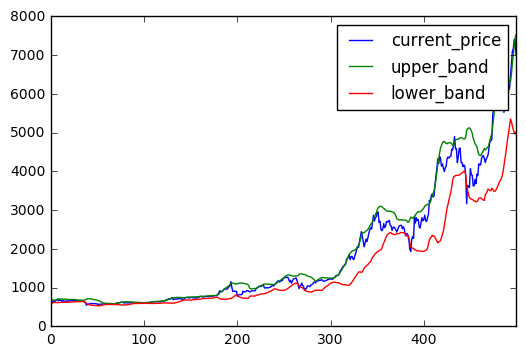
Bitcoin
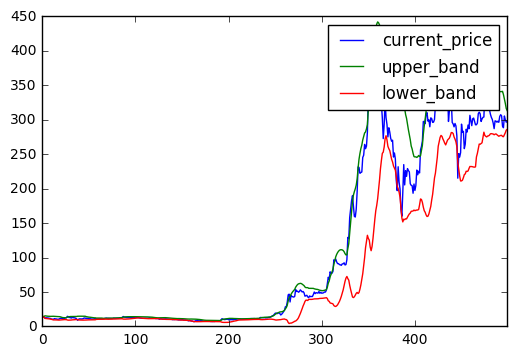
Ethereum
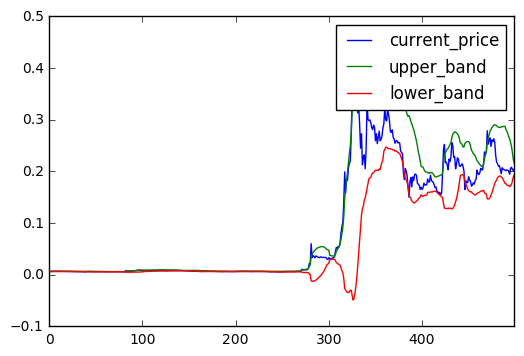
Ripple
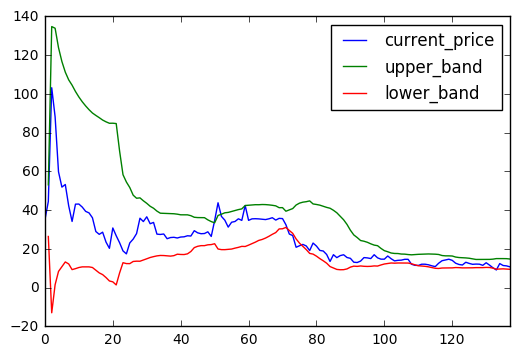
Numeraire
One of the key parts in the test & evaluation process is to explore the effective states and the reward function to use. We have developed 2 types of states: external and internal. External states are the states derived from the market, including current coin price, rolling mean, rolling standard deviation, whether price crosses upper Bollinger band, whether price crosses lower Bollinger band, the value of upper Bollinger band, the value of lower Bollinger band, and ratio of price over moving average. Internal states are those related to the portfolio, including number of coins currently holding, the value of cash currently holding, the total value of the portfolio, whether holding any coins, and the return since entry. From the experiment, we observed that it is more effective to have lesser states input to the model, as more states can bring more noises. Among all the external states, current coin price is proven to be the most effective indicator, as all the other states are derived from it. In terms of internal states, whether a portfolio is holding any coin is proven to be the most effective one.
We have also explored several reward functions. At first, we followed the reinforcement learning standard to use the instantaneous reward like daily returns as our reward function. However, those indicators are quite noisy so they are not able to provide reliable supervision for the model training. Then we realized that using a long-term reward function based on accumulated wealth produced a better result. It is also reasonable as our goal is to maximize the long-term profit.
The final results is shown in the table below.
| Coin | Baseline Model (%) | DQN Model (%) |
|---|---|---|
| Bitcoin | 8.91 | 74.97 |
| Ethereum | 52.62 | 2809.12 |
| Ripple | 58.58 | 122.6 |
| Numeraire | -35.86 | 0.00 |
We can see that in general, our deep Q learning model outperforms the baseline model, and it performs much better when the market is good. When the market is bad, it tends to just holding without doing any trading. This is one of the biggest issue we need to address in the future work.
In the current model, we added 1 bps spread to the price when buy and sell as the trading cost. In the next step, we should include a more practical method to calculate the trading cost. In addition, our current model only supports buy/sell a predefined number of coins per order. We should implement a more flexible action in our next release.
Reference:
Wang et al. Jan 2017. Deep Q-trading. Retrieved from http://cslt.riit.tsinghua.edu.cn/mediawiki/images/5/5f/Dtq.pdf